I was recently at the Bring It Together conference (BIT15) and engaged in an interesting conversation about using Periscope in Education, moderated by Andrew Campbell. We covered many important nuances on the topic, but what resonated with me, in particular was Andrew’s comment that we never seem to celebrate mastery of something, before we feel the need to jump onto the next thing (referring to Periscope vs the various other live stream/video options as well as other tech tools brought up in our conversation).
I’ve been thinking of teaching and learning with Infographics in this context after my Digital Literacy course last week was dedicated to Infographics. I realized that despite the many benefits for teaching with infographics and even more for creating them, that there isn’t very much shared about the genre among the professional learning community I follow on Twitter anymore. I know I started talking about them in 2011 in one of my earliest blog posts.
Are infographics already so yesterday?
Is this another case of abandoning an effective practice for something shiny and new?
Is it important that we teach students how to read and create infographics?
I reaiize that I had fallen victim to this mentality. I too had stopped talking about infographics and instead have been focused on skechnoting which has been popularized by Silvia Tolisano, Sylvia Duckworth, Royan Lee and Vicky Davis, among others. As a fan of Sylvia Duckworth’s work, I even tried my hand at one for this topic using Sylvia’s tutorial. (you have no idea how long this took me to create!!).

And though sketchnoting is a form of data visualization, reading, interpreting, and creating infographics are important for literacy AND numeracy skill acquisition and should NOT be ignored in education today!
Here’s why:
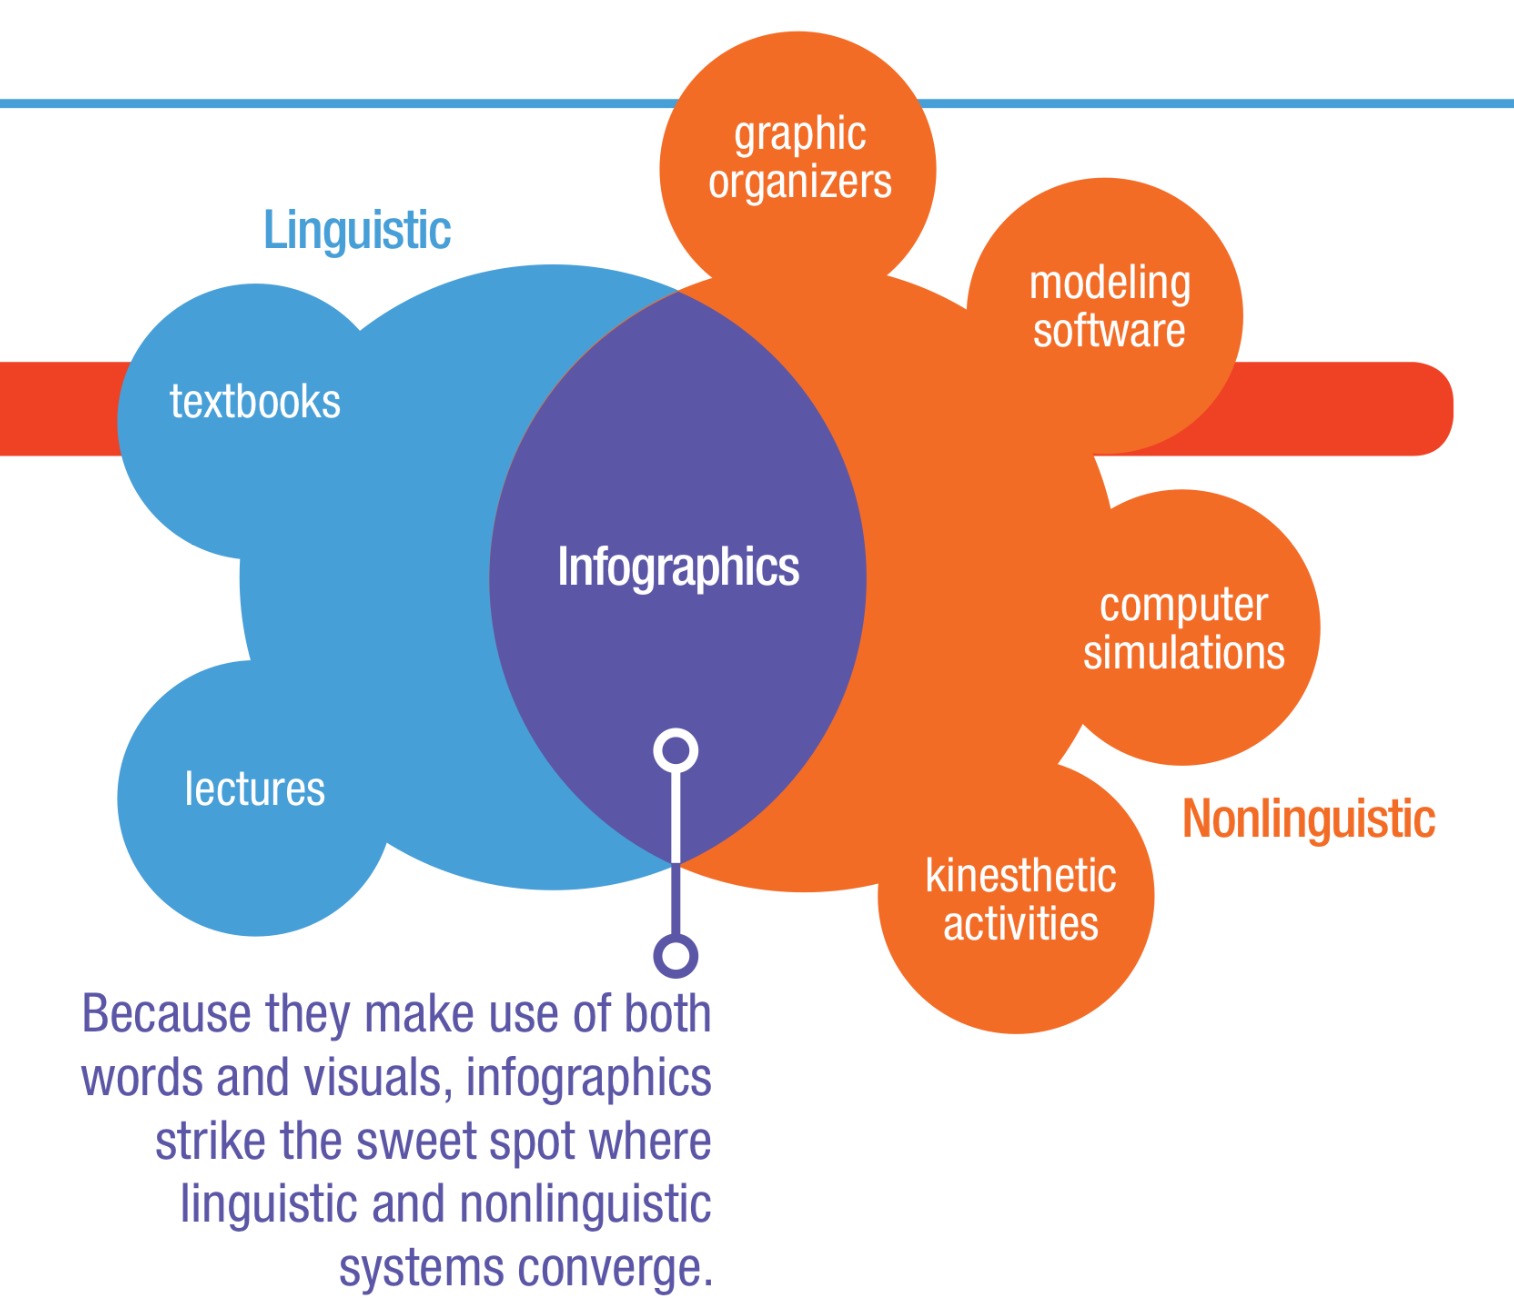 (Krauss, 2012)
Reading Infographics
- Infographics are everywhere; students need to make sense of information in that format.
- Because infographics include both visual and text, they engage more of the brain: The “eye is exquisitely sensitive–language with the eye + language of the mind = two languages both working at the same time” (McCandles, 2010).
- Critical Literacy questions (Whose voice is missing? Is this source credible? What is the purpose? etc…) can be addressed naturally via an infographic.
- The graphics within infographics can sometimes be mis-represented to make a specific point. Looking at the graphics for misrepresentation of data is an important numeracy and critical thinking skill.
Creating infographics
- In order to create an infographic a student needs to sort information, determine what is most important, and organize text and images in a cohesive way. This requires students to think critically and creatively and to communicate ideas effectively.
- Creating infographics really do require tech tools (canva, pictochart) which requires them to practice digital, technical knowledge.
- If students are engaged in an inquiry they can ask their own questions and create their own data (with support). This is important for developing research skills including creating effective questions.
- Data has to be represented accurately. These considerations require both literacy and numeracy skills.
Here is a presentation I created last year which I revised last week. It includes resources to get you started.
Here is presentation with notes about recognizing misrepresented data, created by Diana Santos.
This New York Times Learning Network post shared by Dr. Janette Hughes provides a variety of resources that refer to subject-specific infographics.
I think we need to be cautious as educators about jumping from one fad to another. We need to consider the skills students need to have and commit to those lessons that will meet those needs most effectively. Creating infographics does take time, but considering the skills students are practicing, I think it is time well spent.
References:
Krauss, J. (2012). Leading and Learning with Technology, ISTE. http://files.eric.ed.gov/fulltext/EJ982831.pdf
McCandless, D. (2010). The Beauty of Data Visualization, TED Talk http://www.ted.com/talks/david_mccandless_the_beauty_of_data_visualization